
Summarize this post with AI
Most portfolios do not have a maintenance problem. They have a visibility problem. A property maintenance report that only lists open work orders hides age, repeat failures, and cost, which is where tenant churn and compliance exposure start. The best weekly report tracks seven things per property: backlog, mean time to repair, first time fix, SLA breaches, repeat requests, spend against budget, and vendor performance. This guide shows what to include, how to calculate each number, and how to review them in about thirty minutes across ten buildings or a hundred.
Property Maintenance Report:
A weekly maintenance report should show, per property and in aggregate, open backlog by age, MTTR, first time fix rate, SLA breach count, repeat requests, spend against budget, and vendor performance. Review it weekly against thresholds you set in advance, because movement in these maintenance KPIs predicts tenant complaints and compliance gaps before they reach an incident log. For Singapore and APAC portfolios, add inspection and servicing records so upkeep duties can be evidenced on request.
What is a weekly maintenance report?
A maintenance report is a structured weekly summary of every repair, inspection, and service request across a portfolio, measured against targets. It turns raw work orders from a helpdesk, spreadsheet, or property maintenance tracking software into decisions a head of operations can act on.
It differs from a work order list in one way. A list tells you what is open today. A report tells you whether things are getting better or worse, and where.
A useful report has three layers.
Property view: one row per building with the core metrics
Portfolio view: totals, trends over four to eight weeks, and outliers
Exception view: the five worst items that need an owner this week
The report also answers the question many teams search for: what should a maintenance report include? At minimum, the seven metrics below, plus the evidence trail (photos, invoices, sign off) that proves work was completed. Teams moving off spreadsheets often start by reading why SaaS property management replaces manual tracking as portfolios grow.
Turn AI Ambition Into an Actionable Roadmap
Why weekly tracking matters in 2026
Weekly cadence is the sweet spot. Daily is noise, monthly is too late to fix a failing vendor or a ballooning backlog.
In Singapore, upkeep is not optional for strata developments. The Building Maintenance and Strata Management Act gives management corporations a legal framework to manage and maintain their estates, which makes a clean maintenance record a governance asset, not paperwork.
Internationally, facility teams increasingly anchor their processes to ISO 41001, the standard for facility management systems. It expects demonstrable, effective delivery of facility services, and a weekly report is the simplest evidence of that.
Three pressures make the report more important this year.
Ageing buildings generate more reactive repairs, which crowd out planned work
Tenants and unit owners expect status updates, not silence
Boards and lenders want proof of control across the whole portfolio, not a few sample buildings
Building the data foundation for this takes engineering discipline. That is the territory covered by enterprise AI engineering in Singapore, where data pipelines and governance are designed together rather than bolted on later.
The weekly framework: seven metrics and how to calculate them
Use the same seven metrics for every property so comparisons stay fair.
Backlog. Count open work orders and split them by age: under 7 days, 7 to 30 days, and over 30 days. The age split is the maintenance backlog report that matters, because a large count of fresh tickets is healthy while a small count of old ones is not. To measure backlog, divide open items by average weekly closures to get weeks of work in the queue.
MTTR (mean time to repair). Total hours from request to completion, divided by completed requests. Report it by priority, because averaging an emergency leak with a paint touch up tells you nothing.
First time fix. Jobs resolved on the first visit divided by all completed jobs. A low rate means wasted visits, higher cost, and annoyed tenants.
SLA breach. Requests that missed the response or resolution target, split by priority. Track both counts and the percentage of total.
Repeat requests. Same unit and same fault category within a set window, such as 30 days. Repeats expose poor repairs and failing assets.
Spend against budget. Planned versus reactive spend per property, plus cost per work order. A rising reactive share is an early warning.
Vendor performance. For each contractor: on time arrival, first time fix, rework rate, cost per job, and tenant rating if collected.
Set thresholds before the review, not during it. Example: any property with over 30 day items above an agreed share goes on the exception list.
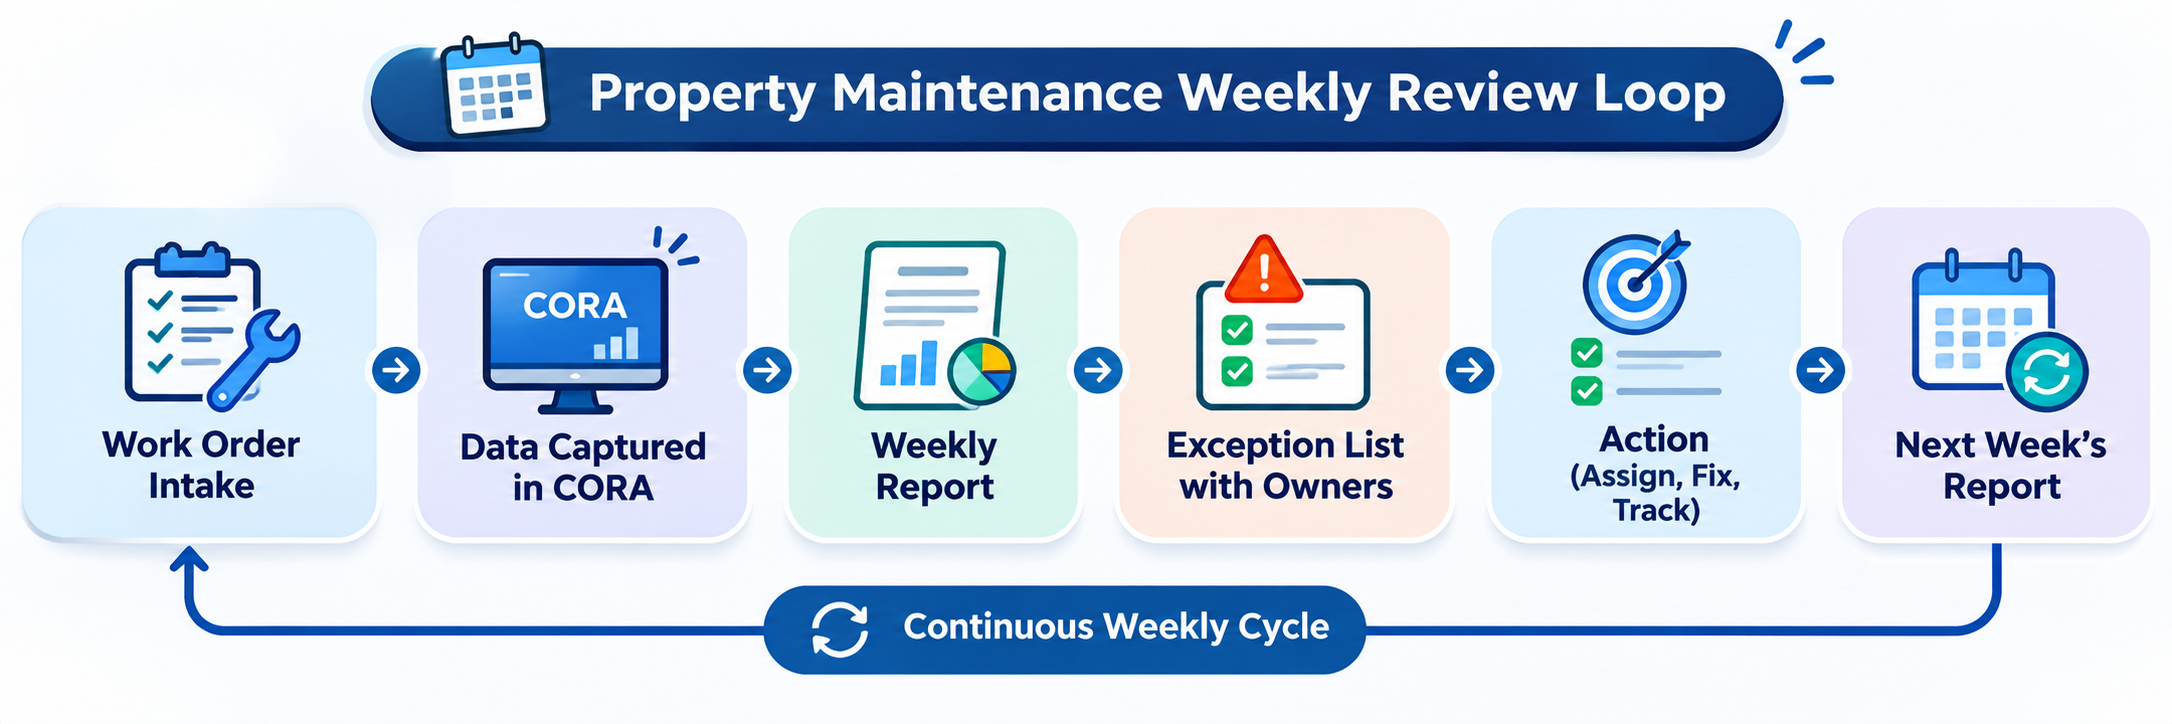
How the data flows into the report
A report is only as good as its inputs. Work orders, finance, vendor, and inspection data usually sit in four different systems. Landing them in a governed store such as Snowflake or Databricks, then reporting through Microsoft Power BI, keeps one version of the truth. Samta.ai acts as the engineering layer here, building the integrations and data models that keep maintenance KPIs consistent across properties.
On the product side, CORA AI driven property management software captures requests, dispatch, and completion in one place, so the numbers above are by products of daily work instead of month end reconstruction. The wider CORA property management platform adds the portfolio view, alerts for SLA breach risk, and vendor scorecards.
The 30 minute weekly review
Open the portfolio view and check trend direction for backlog and MTTR
Read the exception view and assign an owner and date to each item
Review vendor scorecards and flag any contractor below threshold
Confirm inspection and servicing records are current for regulated assets
Record decisions so next week's report can show what changed
How to produce the report: four approaches compared
Teams usually build the report one of four ways. The right choice depends on portfolio size and how many systems feed the data.
Approach | Setup effort | Cross property visibility | Automated alerts | Best fit |
AI native platform (CORA) | Moderate, guided onboarding | Full portfolio view with trends | Yes, SLA breach and ageing alerts | Multi property portfolios wanting live reporting |
Property management suite | Moderate to high | Good within the suite | Partial, often rule based | Teams already standardised on one suite |
Standalone CMMS | High, needs data mapping | Good for assets, weaker for leases and tenants | Yes, for maintenance only | Asset heavy industrial or facilities teams |
Spreadsheets | Low to start, high to maintain | Poor beyond a few properties | None | Single building or pilot reporting |
If you are weighing platforms, this property management software comparison walks through the evaluation criteria. For a head to head view against one widely used incumbent, read CORA vs AppFolio AI.
For teams deciding between a modern platform and older tools, the CORA versus traditional property management software comparison covers where legacy systems fall short on reporting.
Discover Where Your AI Models Are Most Exposed
Real world use cases
These are illustrative scenarios based on common portfolio patterns, not client results.
Regulated portfolio example. A bank or insurer owning commercial buildings and branch premises in Singapore must show that lifts, fire systems, and air conditioning are serviced on schedule. A weekly report that pairs SLA breach counts with servicing evidence lets compliance teams answer an auditor in minutes. Lift upkeep sits within the Building Maintenance and Strata Management lift and building maintenance regulations, so missed servicing dates belong at the top of the exception view.
General enterprise example. A residential operator with several hundred units across multiple estates sees tenant complaints rise. The report shows the cause is not volume but vendor performance: one plumbing contractor has a low first time fix rate and high repeat requests. Replacing that vendor cuts repeat visits and clears old backlog without adding headcount.
For measured outcomes from real deployments, review the Samta.ai case studies before setting your own targets.
Key risks and failure modes
Most weekly reports fail for the same reasons.
Averages hide emergencies. A blended MTTR across all priorities masks slow responses to urgent faults.
Closed does not mean fixed. Without repeat request tracking, a ticket closed twice looks like two successes.
Inconsistent definitions. If one property counts a job complete at dispatch and another at tenant sign off, comparisons are meaningless.
Vendor data lives in email. Performance cannot be scored when invoices and completion photos are not captured in the system.
No owner for exceptions. A report that nobody acts on becomes decoration within a month.
Reactive spend creep goes unnoticed. Planned maintenance quietly shrinks as emergencies consume the budget.
When to build a formal weekly report, and when not to
Build one when:
You manage more than a handful of properties or several vendors per site
Tenants, boards, or lenders ask for evidence of upkeep
Backlog or complaints are rising and the cause is unclear
Data sits in several systems and no one trusts the totals
Wait or keep it simple when:
You run a single building with one contractor and a short request list
Work order data is not captured consistently yet, so fix intake first
Nobody is available to act on the exception list each week
If you are still shortlisting tools, the criteria that matter most are consistent definitions, vendor scorecards, and portfolio level alerts.
Explore What AI Can Do for Your Business
Conclusion
A weekly report earns its place when it changes decisions, not when it fills a slide. Seven consistent metrics, clear thresholds, and an owner for every exception turn scattered work orders into control. Start with backlog age and vendor performance, then add the rest as data quality improves. To see how a connected platform produces these numbers automatically, explore Samta.ai and its CORA product.
About Samta
Samta.ai is a Singapore-headquartered AI Product Engineering & Data Intelligence partner helping enterprises build production-grade AI systems for regulated and data-intensive environments.We help organizations move beyond experimentation by engineering scalable, explainable, and enterprise-ready AI solutions from data foundations and model development to workflow automation and deployment.
Our capabilities combine deep AI expertise, data engineering, and product engineering to deliver measurable business impact across FinTech, BFSI, cybersecurity, regulatory technology, and enterprise operations.
Our enterprise AI products power real-world intelligence systems:
• TATVA : AI-driven data intelligence platform for governed analytics, monitoring, and operational insights
• VEDA : Explainable and audit-ready AI decisioning engine built for compliance-sensitive enterprise workflows
• CORA-Property Management Solutions: : Predictive intelligence platform for real-estate pricing, portfolio optimization, and investment analytics
Backed by ecosystem partnerships with Microsoft, Databricks, Snowflake, and AWS, Samta.ai delivers agile, cost-efficient AI engineering with faster turnaround and enterprise-grade scalability. Trusted by enterprises across FinTech, BFSI, and digital transformation initiatives, Samta.ai embeds AI governance, data privacy, and compliance-by-design principles directly into the AI lifecycle , enabling organizations to scale AI with transparency, accountability, and operational control.
Enterprises leveraging Samta.ai automate 65%+ of repetitive data, analytics, and decision workflows while maintaining governance, explainability, and measurable business outcomes. Samta.ai provides the strategic consulting, AI engineering, and data modernization expertise needed to align enterprise operations with next-generation AI transformation goals.
Frequently asked questions
What should a maintenance report include?
A maintenance report should include open backlog by age, MTTR by priority, first time fix rate, SLA breaches, repeat requests, spend against budget, and vendor performance. Add an exception list with owners and dates, plus evidence such as photos, invoices, and inspection records so work can be verified later.
How do you measure maintenance backlog?
Count open work orders and group them by age, such as under 7 days, 7 to 30 days, and over 30 days. Then divide the open count by average weekly closures to estimate weeks of work waiting. The age split matters more than the raw count, because old items signal stalled work.
What maintenance metrics should I review weekly across properties?
Review backlog age, MTTR, first time fix, SLA breaches, repeat requests, planned versus reactive spend, and vendor performance. Compare each property against its own trend and against the portfolio median. Focus discussion on outliers and the exception list rather than reading every number aloud.
What is a good MTTR for property maintenance?
There is no single good number, because it depends on priority and asset type. Set separate targets for emergencies, urgent, and routine requests, then track whether each improves over time. Source Required for external benchmarks; industry bodies such as IFMA publish facility management benchmarking research.
How is an SLA breach different from an overdue ticket?
An SLA breach means a request missed a response or resolution time promised in an agreement, so it is measured against a defined target. An overdue ticket is simply old. Tracking breaches by priority shows whether you are failing on urgent faults, which carry the most tenant and compliance risk.